Seaborn kernel density estimation
Seaborn Kernel Density Estimation
Kernel density estimation (KDE) is a method for estimating the probability density function of a continuous random variable. It is used in nonparametric analysis.
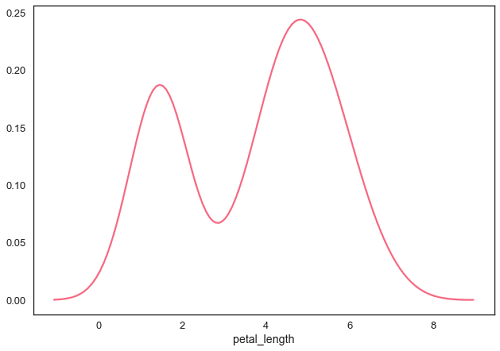
Setting the hist flag to False in distplot will produce a kernel density estimate plot.
Examples
import pandas as pd
import seaborn as sb
from matplotlib import pyplot as plt
df = sb.load_dataset('iris')
sb.distplot(df['petal_length'],hist=False)
plt.show()
Output
 import pandas as pd
import seaborn as sb
from matplotlib import pyplot as plt
df = sb.load_dataset('iris')
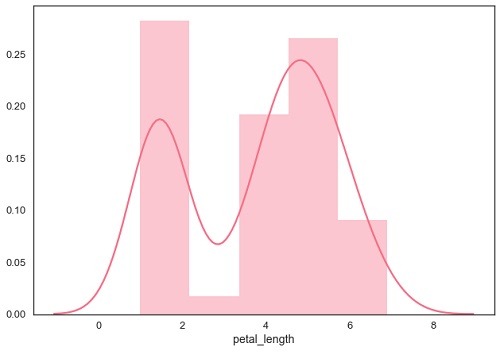
sb.distplot(df['petal_length'])
plt.show()
Output
 import pandas as pd
import seaborn as sb
from matplotlib import pyplot as plt
df = sb.load_dataset('iris')
sb.jointplot(x = 'petal_length', y = 'petal_width', data = df)
plt.show()
Output
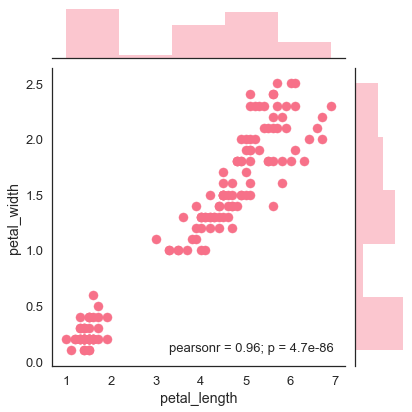
The figure above shows the petal length and width of the iris flower data. The relationship between the petal width and the mean of the petals is shown in Figure 1. The trend in the plot indicates a positive correlation between the variables under investigation.
Hexbin Plot
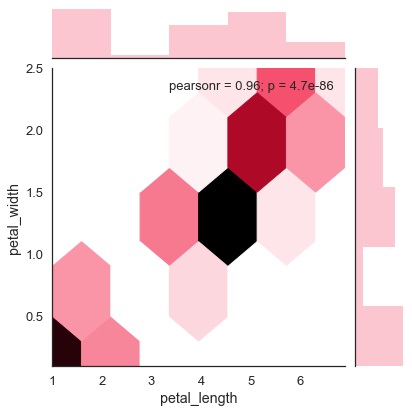
In bivariate data analysis, hexagonal stratification is used when the data density is sparse, that is, when the data is very dispersed and difficult to analyze using a scatter plot.
Additional parameters called “kind” and “hex” enable the creation of hexbin plots.
Example
import pandas as pd
import seaborn as sb
from matplotlib import pyplot as plt
df = sb.load_dataset('iris')
sb.jointplot(x = 'petal_length', y = 'petal_width', data = df, kind = 'hex')
plt.show()
Kernel Density Estimation
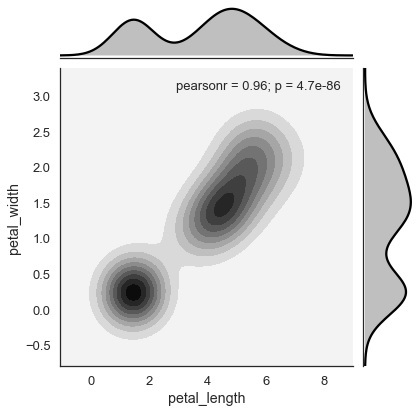
Kernel density estimation is a nonparametric method for estimating the distribution of a variable. In seaborn, we can use jointplot() to plot the kde.
Pass the value ‘kde’ to the argument kind to plot the kernel plot.
Example
import pandas as pd
import seaborn as sb
from matplotlib import pyplot as plt
df = sb.load_dataset('iris')
sb.jointplot(x = 'petal_length', y = 'petal_width', data = df, kind = 'hex')
plt.show()
Output
